


Bitcoin price has hit a new all-time high above $124k, fueled by increasing odds of a Fed rate cut in September, boosted by July’s U.S. CPI reading.
Summary
- Bitcoin hit an alltime high of $124,000 as odds of a Fed rate cut in September rose.
- Spot Bitcoin ETFs drew over $1 billion in net inflows over the past five sessions.
- An ascending channel pattern has formed on the BTC 4-hour chart.
According to data from crypto.news, Bitcoin (BTC) rose over 8.5% in the past 7 days to $124,128 on Friday, morning Asian time, setting a new all-time high. It has since dipped slightly lower to $123,197 as of press time, still holding gains of 32% since the beginning of this year and over 62% from its year-to-date low.
Bitcoin’s push to fresh highs came a day after the U.S. released the July CPI report, which showed annual inflation steady at 2.7%, matching June’s rate and coming in below the 2.8% forecast. The report also indicated overall consumer prices rose 0.2% month-on-month, down from a 0.3% gain in June.
The CME FedWatch, a closely tracked tool for gauging market expectations of Federal Reserve interest rate changes, showed the odds of a rate cut at the September meeting rising to 95.8% after the U.S. CPI print.
A Fed rate cut would lower borrowing costs and increase liquidity, often prompting investors to shift into risk-on assets like cryptocurrencies in search of higher returns.
Inflows into spot Bitcoin and Ethereum ETFs have also been a pivotal factor supporting BTC’s rally to new all-time highs.
SoSoValue data show that the 12 spot BTC ETFs have attracted over $1 billion in net inflows over the last five trading days, while their Ether counterparts pulled in around $1 billion on Tuesday alone, together sparking bullish sentiment across the crypto market.
A look at the BTC liquidation heatmap from CoinGlass shows that Bitcoin’s recent move to new highs was accompanied by a wave of short liquidations, particularly in the $124,000–$126,000 range, as price pressure forced traders betting against the rally to close positions. This short covering likely amplified the upward momentum during the run-up.

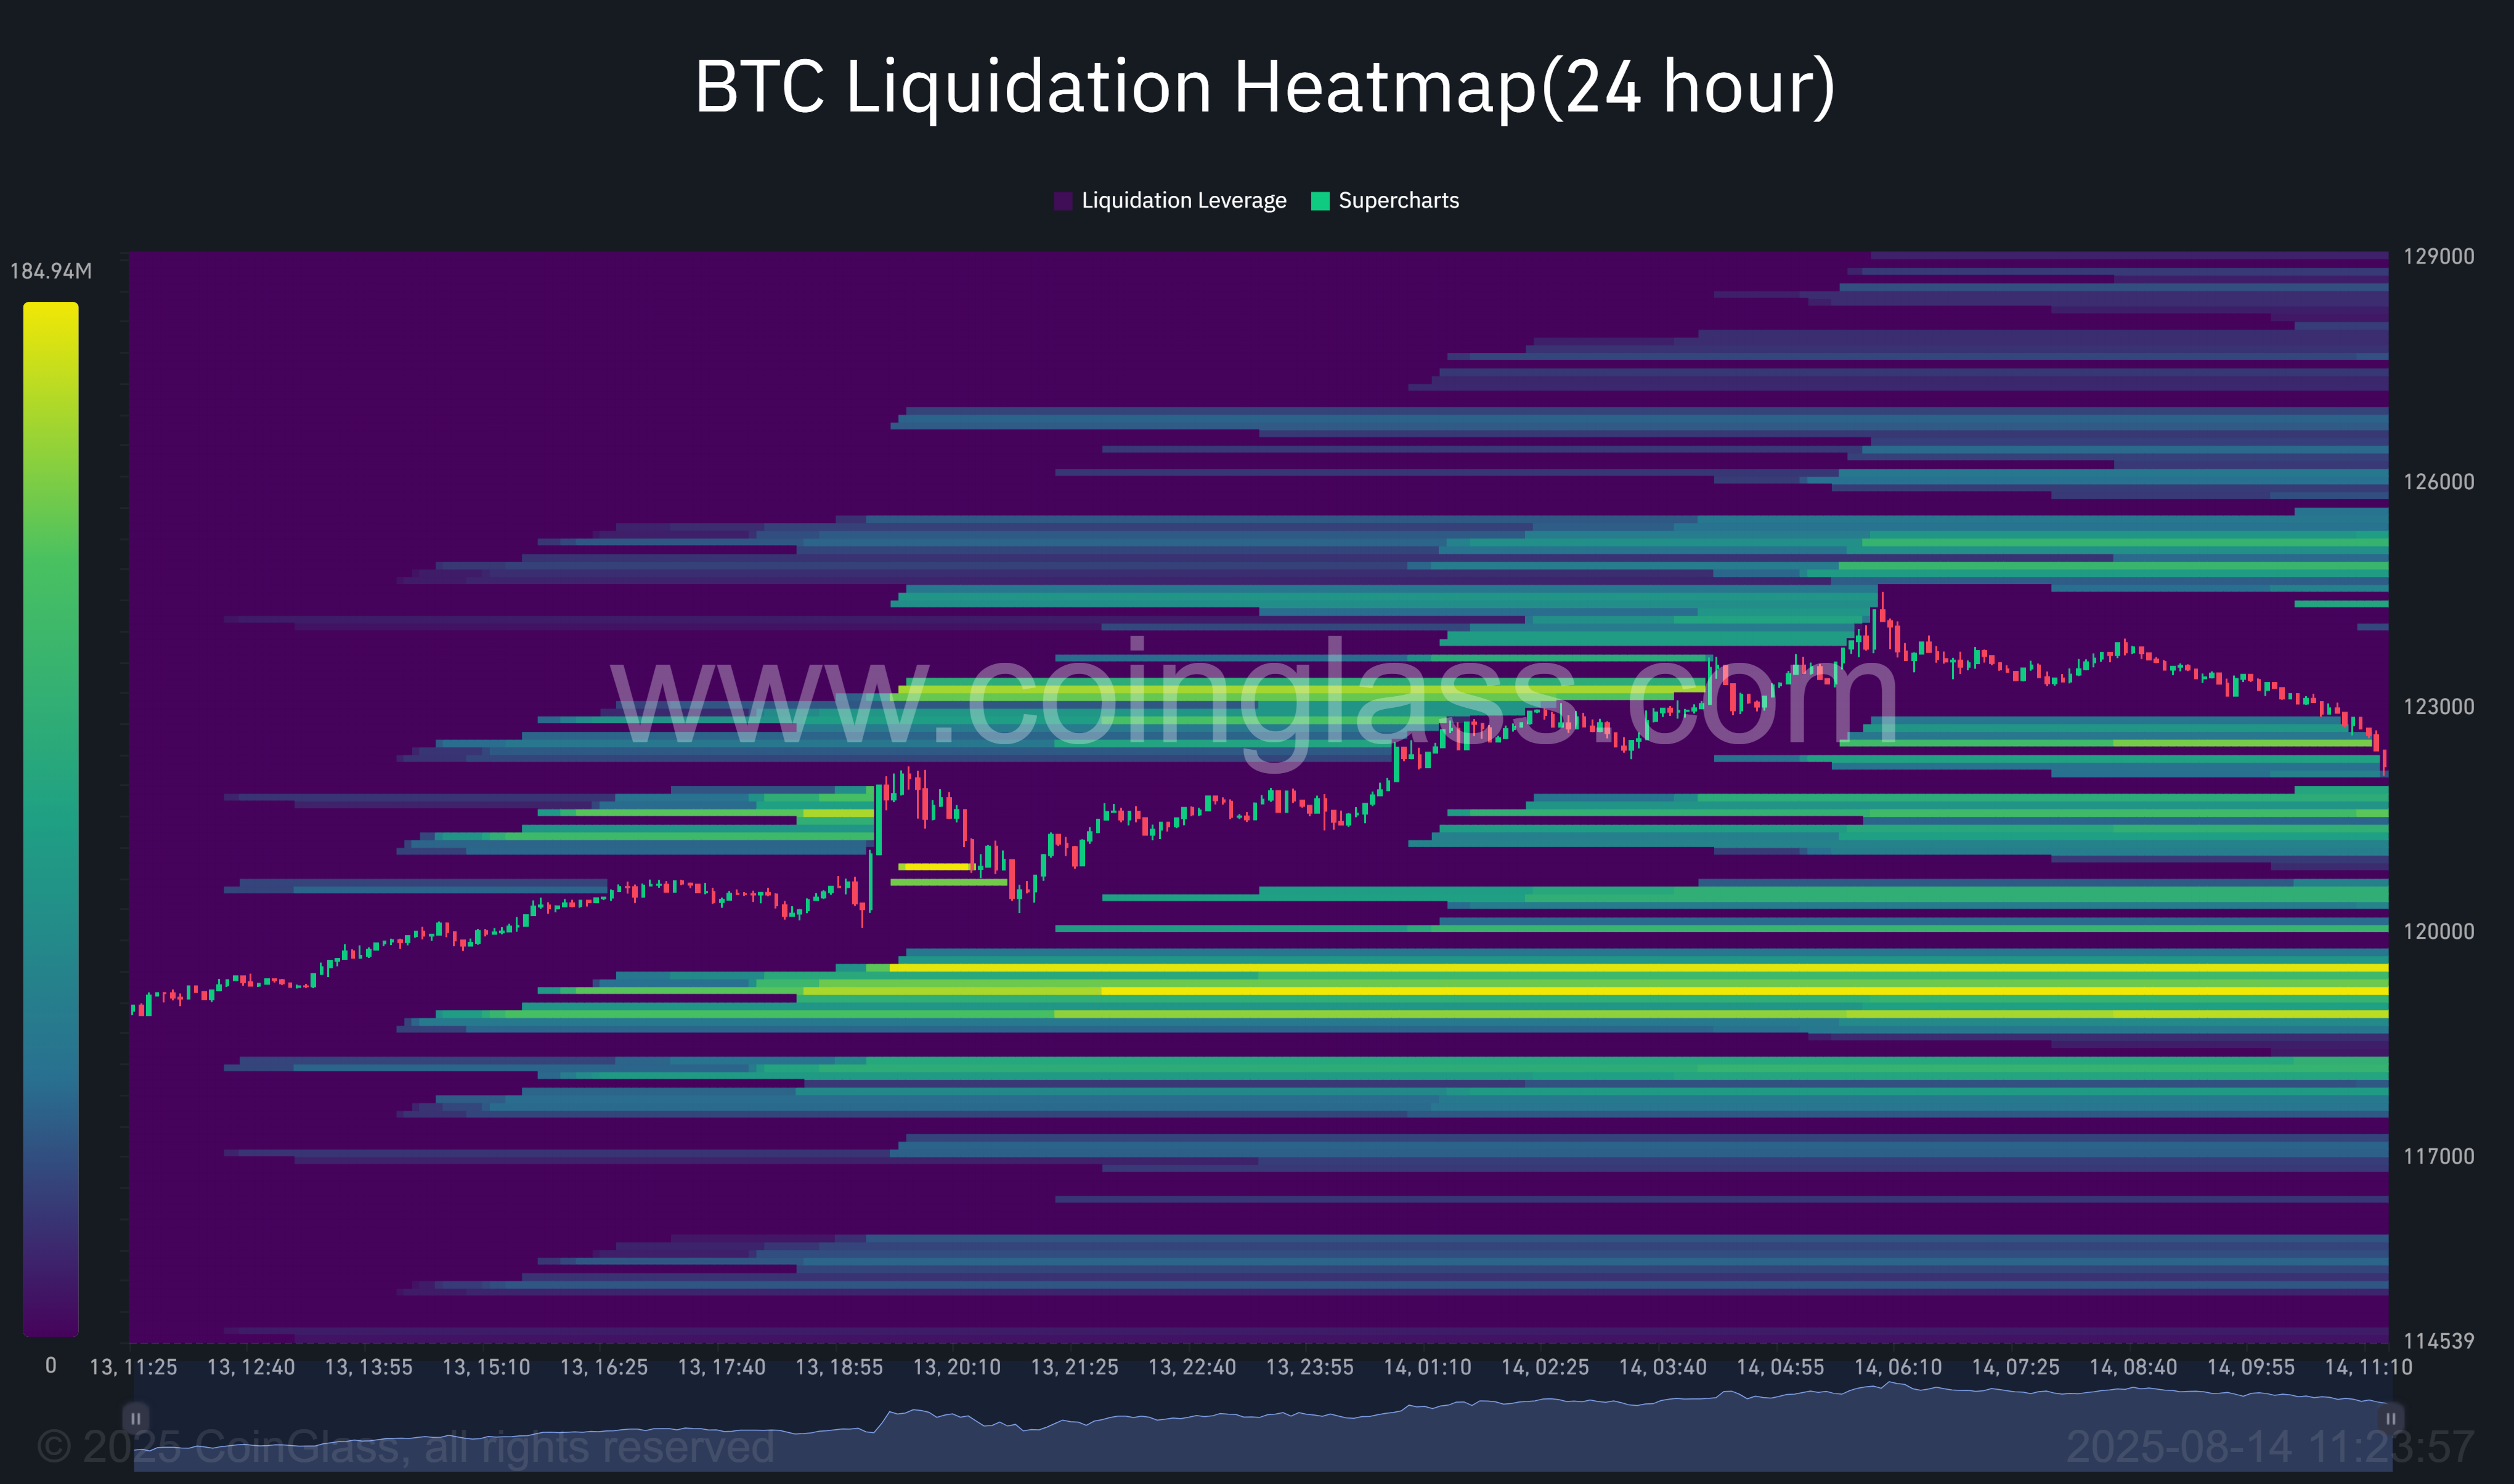
However, the chart also reveals a dense concentration of long liquidation levels clustered around $120,000–$121,000. If the price were to retrace into this zone, it could trigger a cascade of forced selling, accelerating downside pressure.
BTC price analysis
Bitcoin appears to have formed an ascending parallel channel pattern on the 4-hour chart, which consists of higher highs and higher lows contained within two upward-sloping parallel lines. This formation typically signals a continuation of the prevailing uptrend.

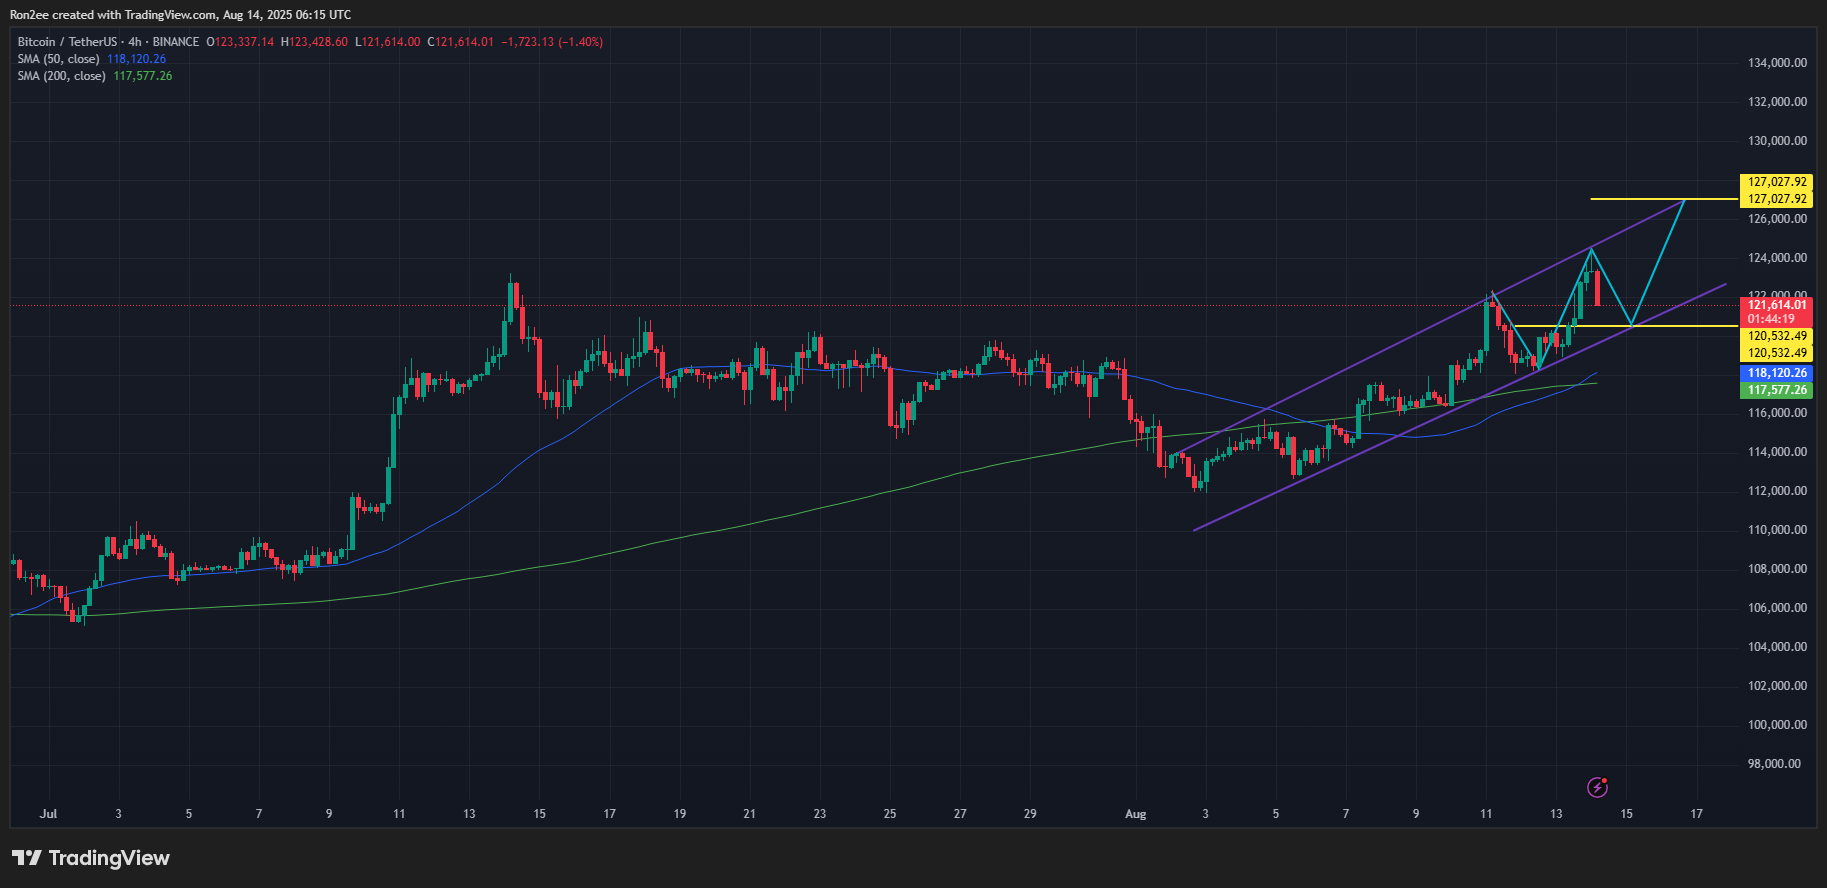
The token’s price is currently retracing after touching the channel’s upper boundary, with a move toward approximately $120,500 likely by the end of the current session. If BTC holds support at this level, it could rebound toward $127,000 in the next leg higher, assuming it continues to trade within the channel.
The bullish crossover of the 50-day moving average above the 200-day moving average further reinforces the upward bias, indicating sustained positive momentum in the trend.
Disclosure: This article does not represent investment advice. The content and materials featured on this page are for educational purposes only.

")

