



Key Takeaways
- Bitcoin’s price managed to hold the $76,000 foundation level on Sept. 2, even after sliding 2.2% on the 1-hour chart.
- Zooming out, bitcoin was still up a solid 17.8% over the daily window, despite pulling back from its $81,455 high.
- For now, $75,000 is the big level to watch, while 11 moving averages are still flashing bullish signals.
Bitcoin’s 1-Hour Chart Puts $76,229 in Play
On Wednesday, bitcoin’s price on the 1-hour chart logged a 2.2% decline from $78,542 to $76,810, clocking a $79,250 high before bitcoin’s price fell to an intraday low of $76,229. Buyers bounced it to $76,775, but the following hour slipped to $76,568 before another move to $76,810 on just 17 BTC of trading volume.

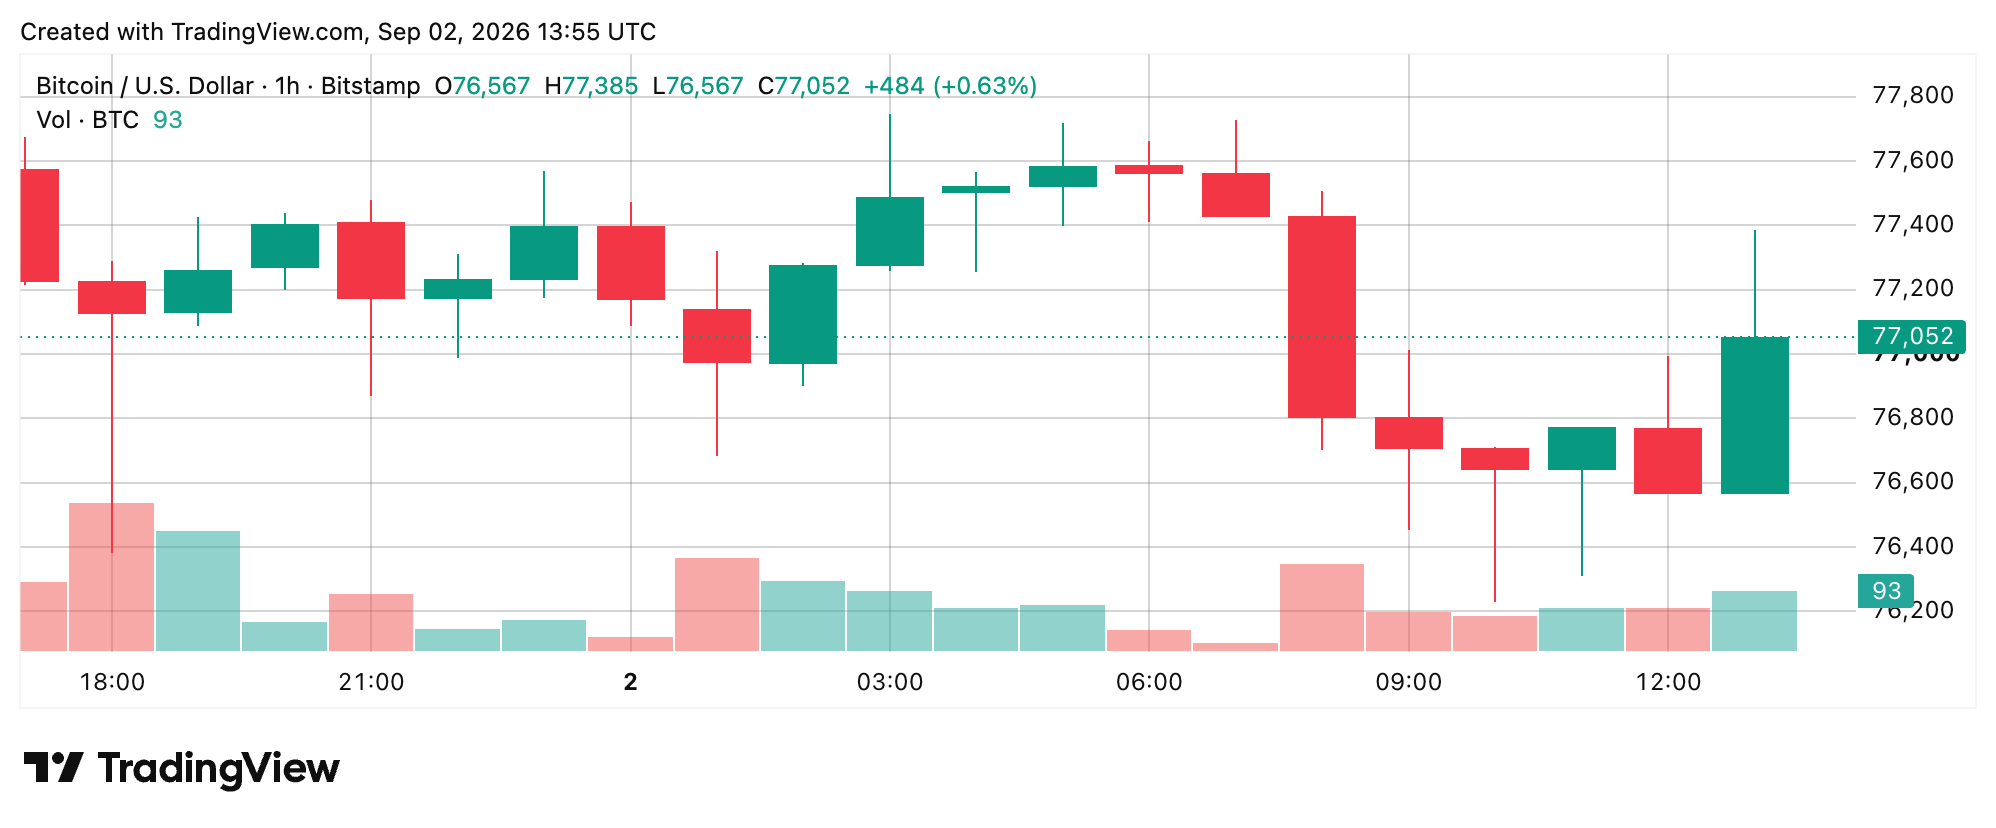
Funnily enough, the rebound leaves a whole lot unresolved. Support sits at $75,000 to $76,000, while real resistance begins at $78,000 to $79,000. A close above $78,000 would provide the first evidence that the latest sell-off was absorbed. On the flip side, a close below $76,000 or even $75,000 would invalidate the bounce.
Bitcoin’s 4-Hour Structure Keeps Sellers in Control
The 4-hour chart logged a 0.66% bitcoin price decline from $77,328 to $76,819 after clocking its $81,455 high on Aug. 28. Bitcoin’s price subsequently produced lower highs and tested $76,229 twice. The latest green candle logged only 84 BTC in volume, compared with 375 to 875 BTC on the first day of the month’s selling bars.
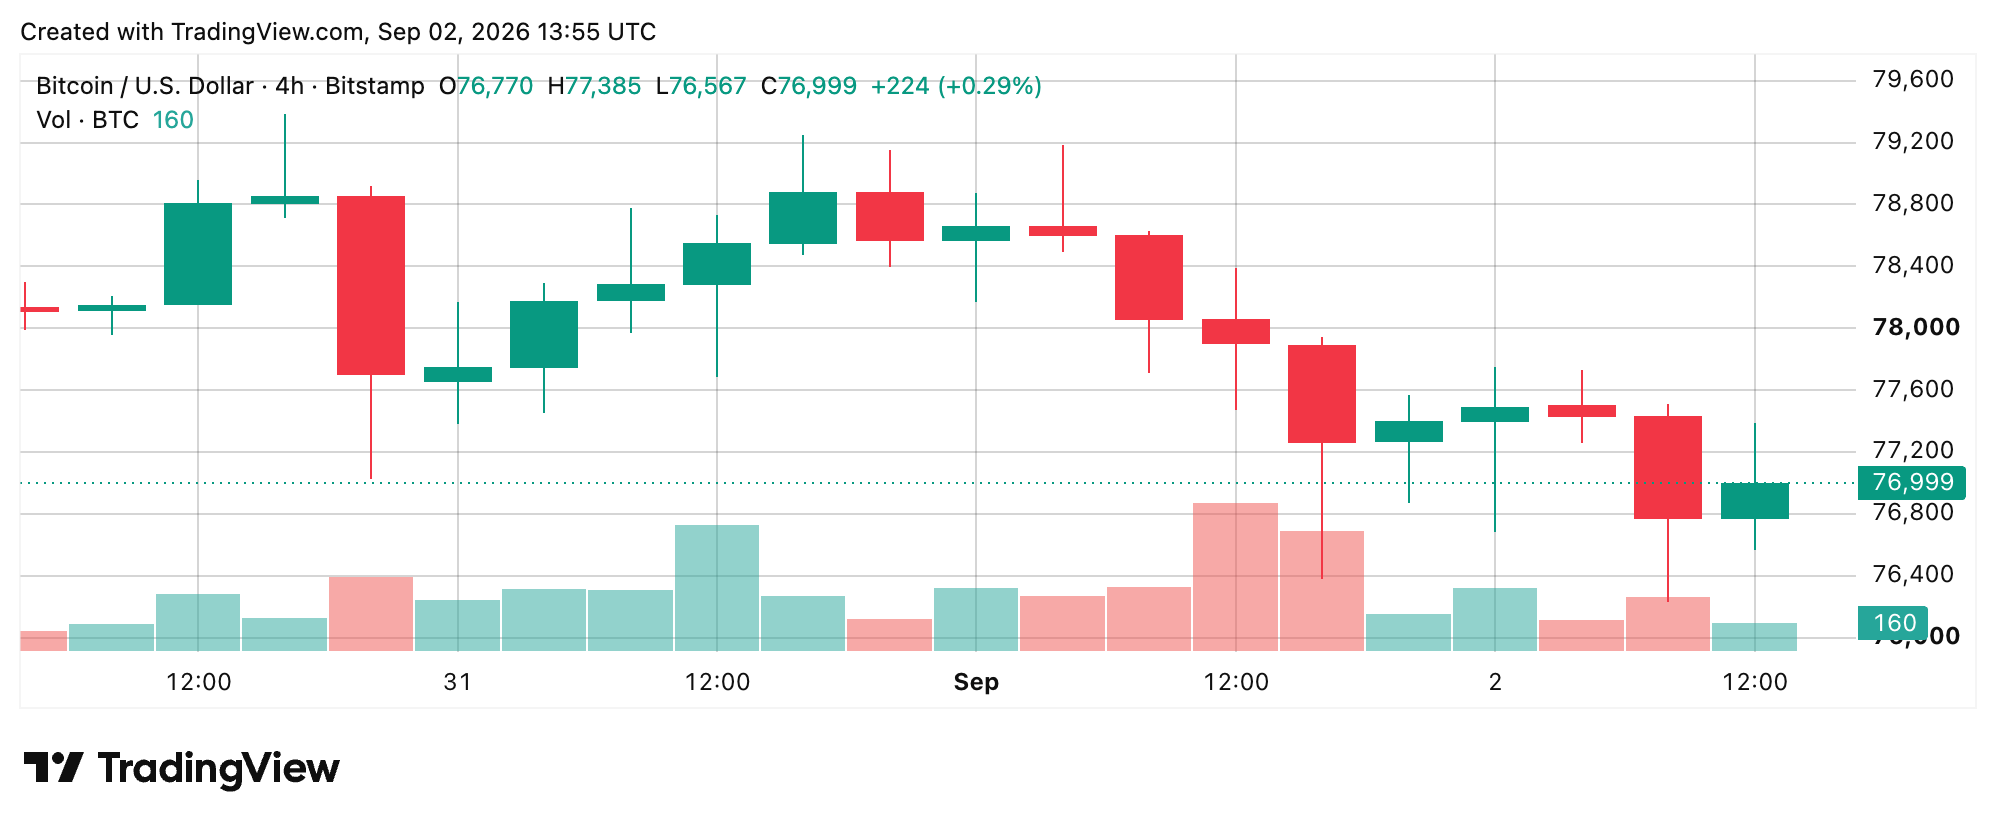
That is significant because the jump back has attracted a whole lot less volume than the preceding decline. On the other hand, reclaiming $77,400 to $77,750 would negate the latest lower high. A close below $76,000 would produce a range-expansion low. Traders will be eying these resistance points and foundations closely.
Daily Bitcoin Chart Keeps the Bigger Advance Intact
The daily picture offers a great deal more strength. Bitcoin’s price logged a 17.8% increase from $65,212.60 to $76,819.40 during the reviewed period, despite retreating from $81,455. Still, highs of $81,455, $79,386, $79,250 and $79,184 formed a significant lower-high sequence.
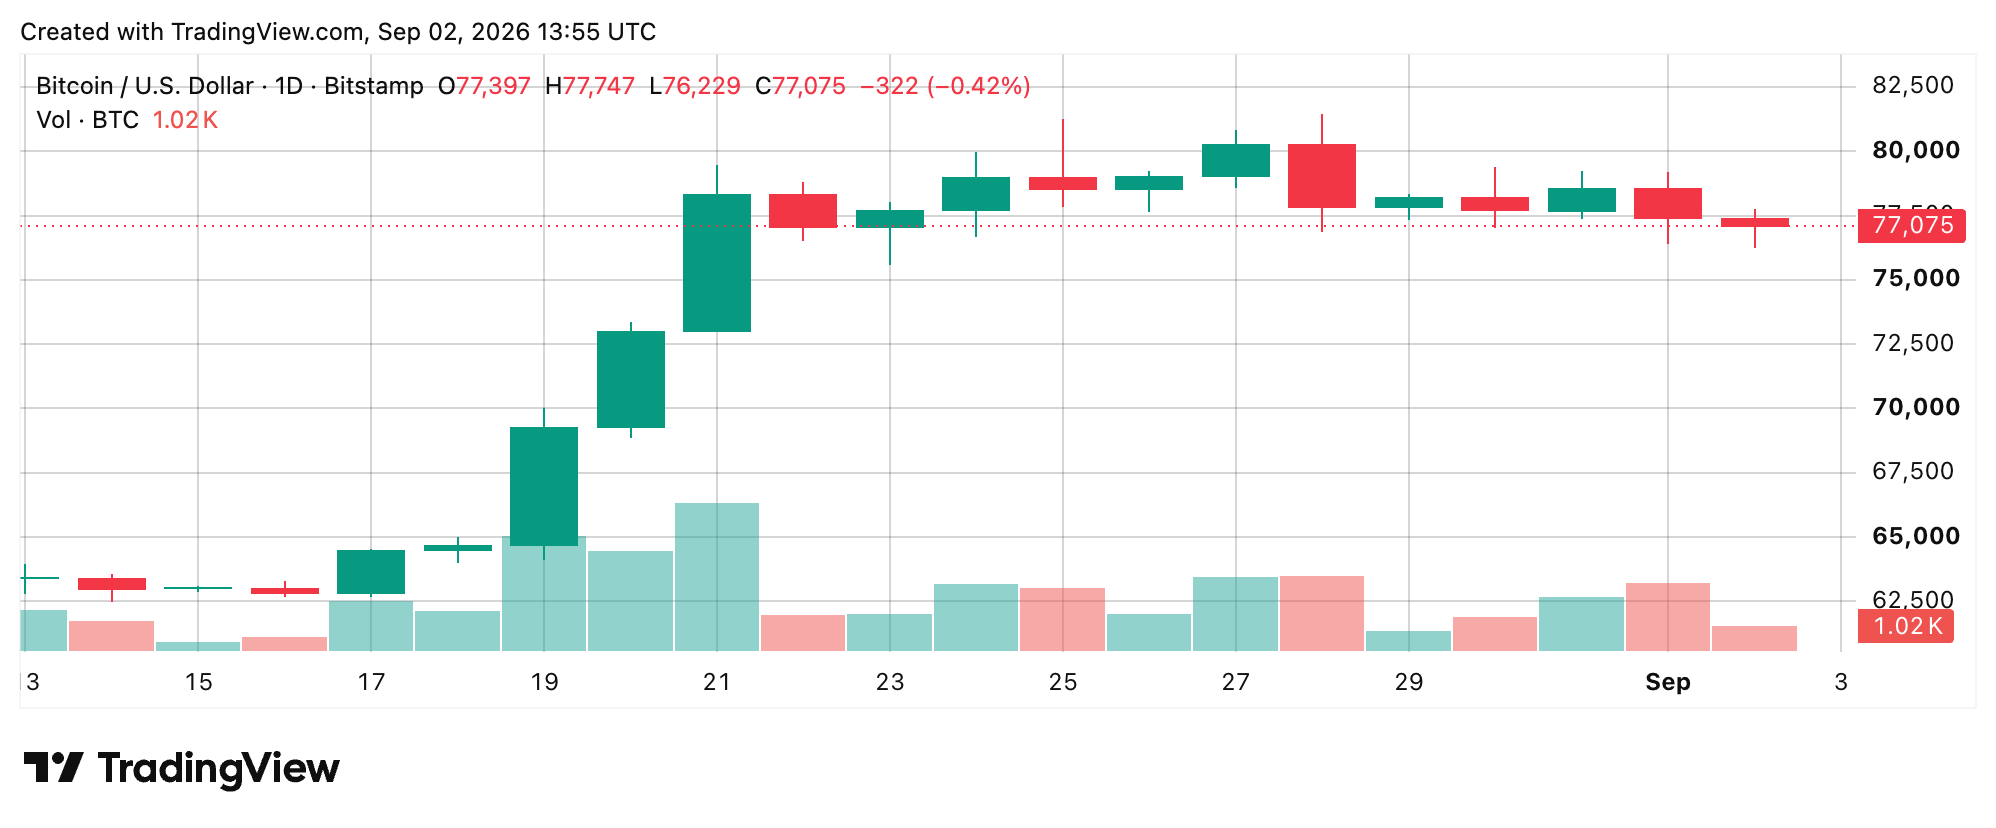
In the volatile land of bitcoin ever-moving prices, support now runs from $76,000 toward the 20-period volume-weighted moving average (VWMA) at $75,055 and 20-period exponential moving average (EMA) at $74,594. On the flip side, resistance stretches from $77,747 through roughly $79,250.
Oscillators Leave a Whole Lot of Signals Stuck in Neutral
Funnily enough, nine of bitcoin’s 11 oscillators were neutral on the daily chart Wednesday morning. The relative strength index (RSI) clocked 63, the Stochastic logged 75, the commodity channel index (CCI) was around 38, the average directional index (ADX) (14) was 43, and the Awesome oscillator (AO) clocked 8,231.
Stochastic RSI Fast, Williams percent range, bull bear power (BBP), and the ultimate oscillator (UO) were also meandering in the neutral lane. On the other hand, momentum at minus 801 and moving average convergence divergence Level (MACD Level) at 3,350 logged bearish signals. An oversold washout is therefore not in the cards, at least for the time being.
Moving Averages Show Where Bitcoin’s Next Fight Sits
The daily chart’s moving averages (MAs) logged roughly 11 bullish signals, three bearish ones and a single neutral reading, creating a significant split between short- and longer-term conditions. The 10-period exponential moving average (EMA) at $77,100, 10-period simple moving average (SMA) at $78,348, and 9-period hull moving average (Hull MA) at $77,313 logged sells.
At the same time, the 20-, 30-, 50-, 100- and 200-period EMAs and SMAs, plus the 20-period VWMA, logged a positive trend. The Ichimoku base line on Wednesday morning was neutral. That leaves a great deal riding on $76,000 foundation and below, and $77,000 to $78,000 and above, before a whole lot more directional confirmation is in the cards.
Bull Verdict:
Bulls still have a great deal working in their favor, especially with bitcoin holding above most of its longer-term moving averages. If bitcoin can get back above $77,000 and start pushing through the short-term resistance overhead, the recent weakness could begin to look more like a pullback than a larger breakdown.
Bear Verdict:
Bears still have a great deal to work with in the short term, with bitcoin logging lower highs and struggling to build a convincing rebound from $76,229. If that level finally gives way, the current bounce loses its footing and the short-term technical picture would weaken further.


