


Bitcoin just broke out of a six-week bearish price pattern, a technical signal many traders watch for trend changes. BTC traded near $91,300 after pushing through long-standing resistance, shaking off weeks of sideways action. This move lands as institutional money keeps flowing in through ETFs, even as global tensions test risk appetite.
Price action matters because breakouts often reset investor psychology. After weeks of hesitation, buyers finally stepped in with conviction. The question now is simple. Does this move have real fuel, or does it fade?
Zooming out, Bitcoin entered 2026 with strong momentum behind it. Spot Bitcoin ETFs and corporate treasuries continue to soak up supply, changing how fast pullbacks get bought.
DISCOVER: Top Ethereum Meme Coins to Buy in 2026
What Does a “Bear Pattern Breakout” Mean for Beginners?
A bear pattern is like a ball rolling downhill in smaller and smaller hops. Each bounce gets weaker. When price breaks above that slope, traders read it as momentum shifting.
In this case, Bitcoin escaped a six-week descending wedge. That simply means sellers lost control. Buyers finally pushed price higher. This matters because technical traders often act together. When enough charts flash the same signal, short-term demand increases fast.
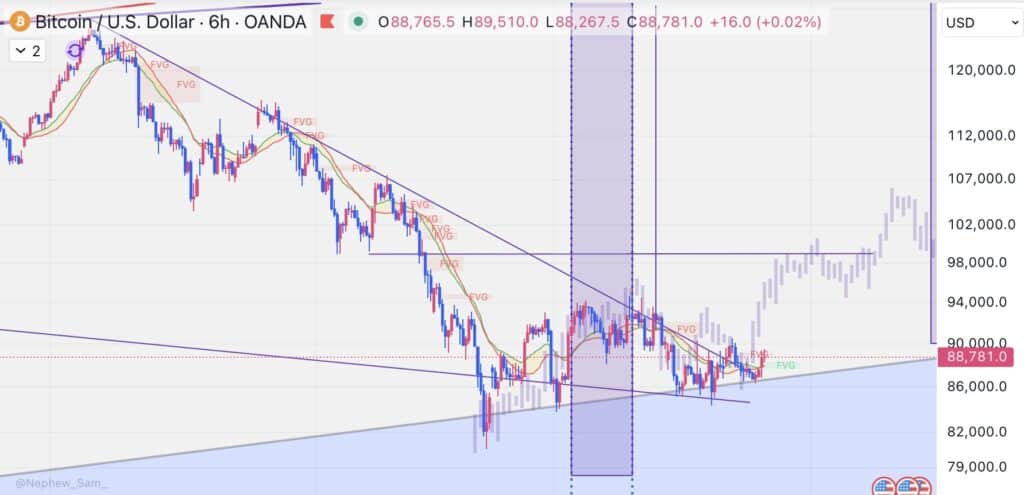
(Source: BTC Broke the descending wedge by going above $88k / TradingView)
On-chain data adds context. Large holders reversed recent selling and bought about 10,000 BTC after price cleared $90,000. That buying absorbed selling pressure from miners and short-term traders.
For everyday investors, this signals confidence from deep-pocketed players. It does not promise instant gains. It shows who is willing to buy at these levels.
DISCOVER: Top Ethereum Meme Coins to Buy in 2026
How Are ETFs and Institutions Supporting This Move?
Spot Bitcoin ETFs act like vacuum cleaners. When investors buy ETF shares, providers must buy real Bitcoin. U.S. crypto ETFs pulled in $5.95 billion during peak inflow periods in 2025. That demand helped push Bitcoin above $125,000 last year.
Those flows still matter now. ETFs reduce available supply, which makes breakouts easier to sustain. Corporate treasuries also play a role. Public companies held over 1 million BTC by the end of 2025. These buyers tend to hold, not flip.
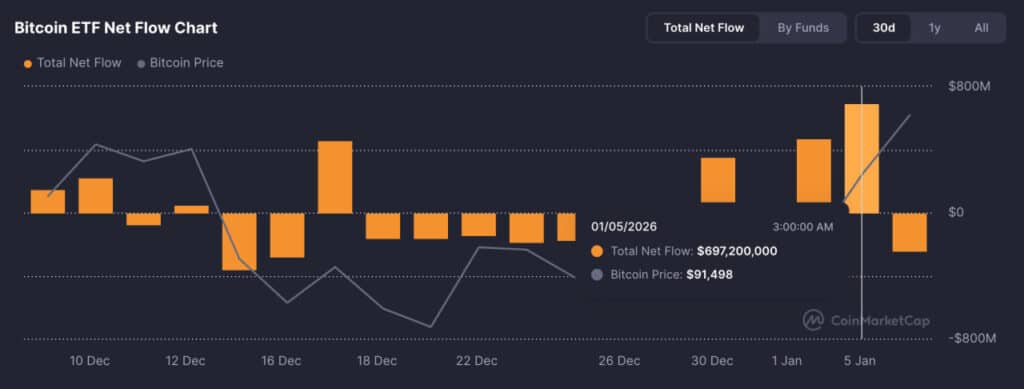

(Source: Bitcoin ETF Data / CMC)
This institutional base explains why dips near $90,000 attract buyers quickly. Demand shows up before panic can spread.
What Are the Risks That Could Stall the Rally?
Miners increased selling as price climbed. Think of miners like gold producers. When prices rise, they sell to cover costs. Miner outflows jumped above 600 BTC in a day. That supply can slow momentum even during bullish phases.
Technical levels also matter. Bitcoin must hold above $92,000 to aim for $95,000. Strong resistance sits near $97,000. Macro shocks remain the wildcard. Global markets still react to geopolitical headlines. Risk-off moves often pressure crypto first.
For beginners, the lesson is simple. Breakouts invite excitement. They also invite volatility if you are buying here; size matters. Never chase green candles with money you need for rent or bills.
$BTC has started to fill its CME gap now. pic.twitter.com/zGDv8MFP6c
— Ted (@TedPillows) January 7, 2026
Bitcoin’s trend looks healthier than it did a month ago. Confirmation comes from patience, not prediction.
DISCOVER: Top Solana Meme Coins to Buy in 2026
Follow 99Bitcoins on X For the Latest Market Updates and Subscribe on YouTube For Daily Expert Market Analysis
The post Bitcoin Price Breaks 6-Week Downtrend—Is This Rally Real? appeared first on 99Bitcoins.


