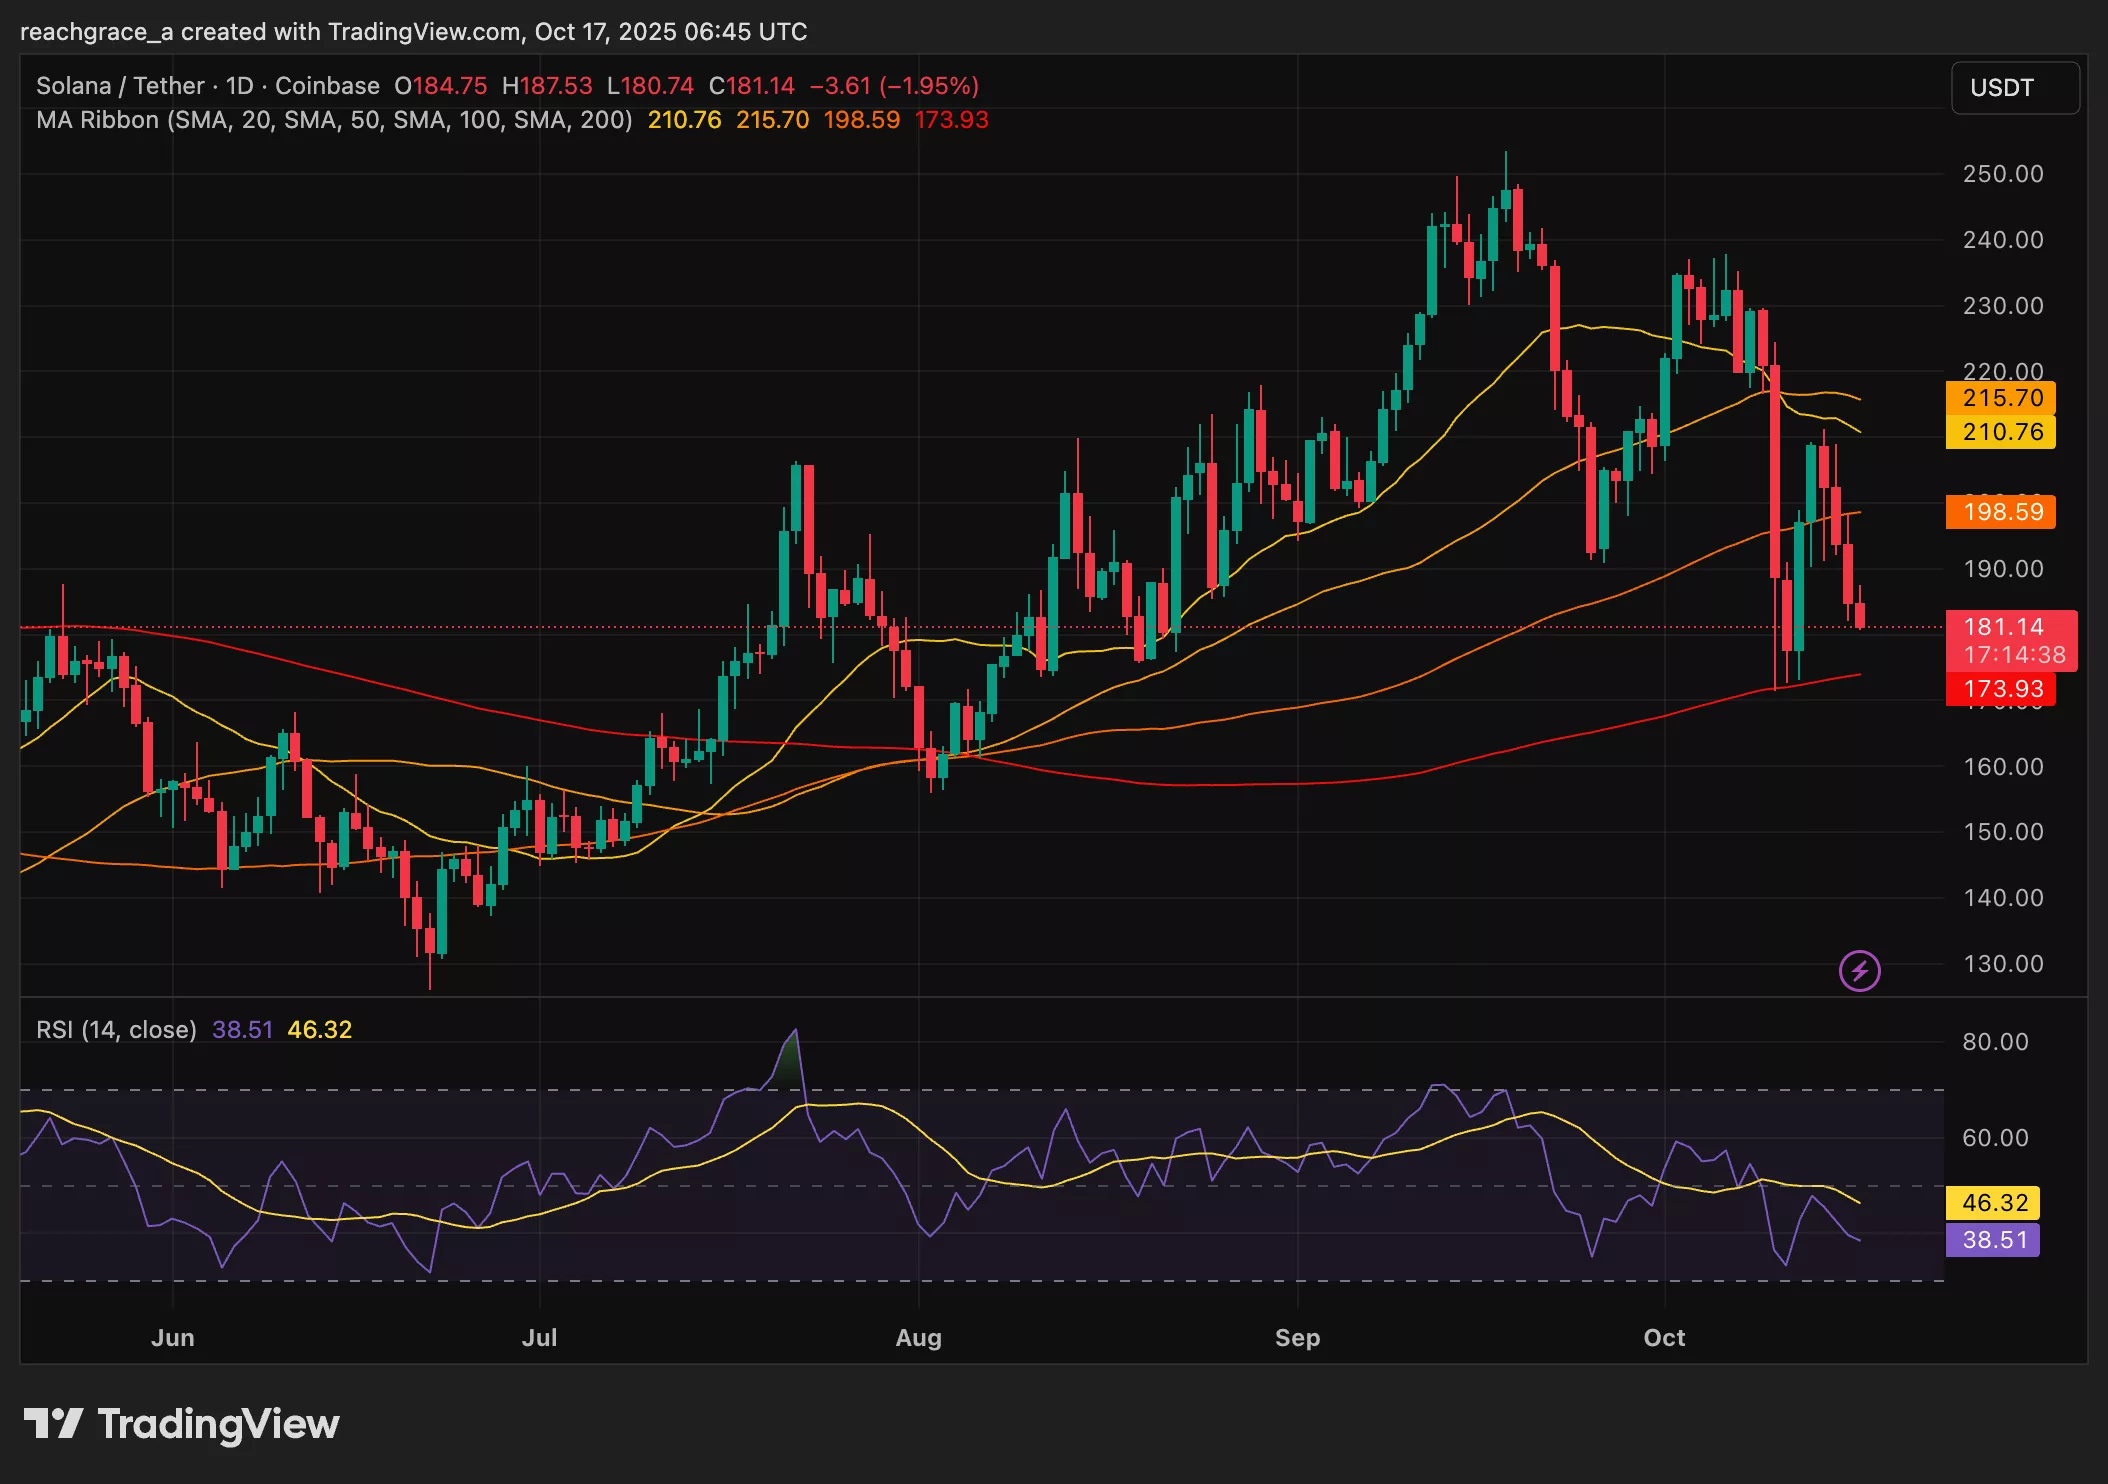
Solana price is showing signs of weakness as clouds return to its short-term outlook, with the token drifting closer to a key support level.
Summary
- SOL has dropped to $181, down over 6% on the day and more than 17% this week, as bearish momentum strengthens and sellers dominate the market.
- Technical indicators flash caution, with the RSI near 39 and key moving averages tightening, suggesting further downside if support fails to hold.
- A rebound could hinge on institutional demand and optimism around potential Solana-based ETF approvals, which have previously driven major recoveries in SOL’s price.
Solana price is currently trading at $181, shedding over 6% in the past 24 hours and down more than 17% for the week. After rallying above $220 just over a week ago, the token has since tumbled on successive sessions of selling, reversing momentum built up at the start of the month.
The sharp decline comes as bearish momentum strengthens on the charts. Solana (SOL) began its current slide after failing to reclaim the $210 threshold, with back-to-back red daily candles marking growing pressure from sellers. Technical signals point to a market unable to absorb recent high-volume liquidations, forcing the token down to test lower support.
Solana’s retreat is part of a broader downturn in the crypto market, mirroring losses seen across top altcoins and following renewed weakness in Bitcoin and Ethereum. The parallel drawdown echoes last week’s major Friday selloff, which wiped more than 20% off Solana’s market value in hours and brought the token as low as $168.
For now, bears are firmly in control as Solana price hovers at these critical levels. With volatility still high and no clear catalyst for a reversal, the question is whether current support can hold or if a deeper drop is imminent.
Technical signals hint at further downside as Solana price tests key support
Looking ahead, technical signals point to caution. SOL’s Relative Strength Index (RSI) is near oversold territory, printing around 39 on the daily chart, which signals weakening momentum with the risk of further downside if selling persists.
The 20-day and 100-day moving averages are converging, with price now sitting just above the longer-term 200-day average. If Solana breaks $180, the next support lies near $168, last week’s crash low, and potentially $150 if the broader market continues to unwind.

A bullish reversal would require a sustained defense of the $180 level, followed by a decisive move back above the 100-day average to rebuild confidence. Positive triggers could come from renewed corporate accumulation or from an upswing in optimism around anticipated Solana-based ETF launches.
Both institutional accumulation and regulatory progress have historically triggered sharp recoveries in Solana’s price. Without these drivers, however, the risk of further losses remains.


![HAL (Formally Napbots) Review [October 2025]](https://chainarticles.news/wp-content/uploads/2025/10/Frame-2101-1-238x178.jpg)

