
SOL is trading dangerously close to $93 caught in a clash between two powerful market forces. The market is torn between two realities: Solana price has surged 7% since Sunday fuelled by strong ETF demand. However volume is declining as it nears the psychological resistance at $100.
This is the definition of a binary trade: either the institutional bid absorbs the selling pressure and forces a breakout, or the technical pattern triggers a trapdoor event. The entire setup now hinges on a single question: can bulls punch through $100 before the bears seize control of the $85 neckline?
ETF FLOW UPDATE: Spot crypto ETFs recorded mixed flows last week.
• $BTC: +$767.33M
• $ETH: +$160.82M
• $SOL: +$10.7M
• $XRP: -$28.07MInstitutional demand remains strongest for BTC and ETH ETFs.
— The Crypto Times (@CryptoTimes_io) March 16, 2026
DISCOVER: The Next 1000x Crypto Gem Before It Lists on Exchanges
Institutional Demand for Solana ETF: The $10.7 Million Floor
If you look strictly at the flow of money, the bull case for Solana seems obvious. While retail traders have been distracted, institutional heavyweights have been quietly accumulating SOL at an aggressive pace. Last week alone, Solana ETF saw a net inflow of $10.70 million, with a massive $7.60 million entering the market on Friday alone. This brings the year-to-date inflows for Solana products to nearly $900 million, dwarfing almost every other altcoin.
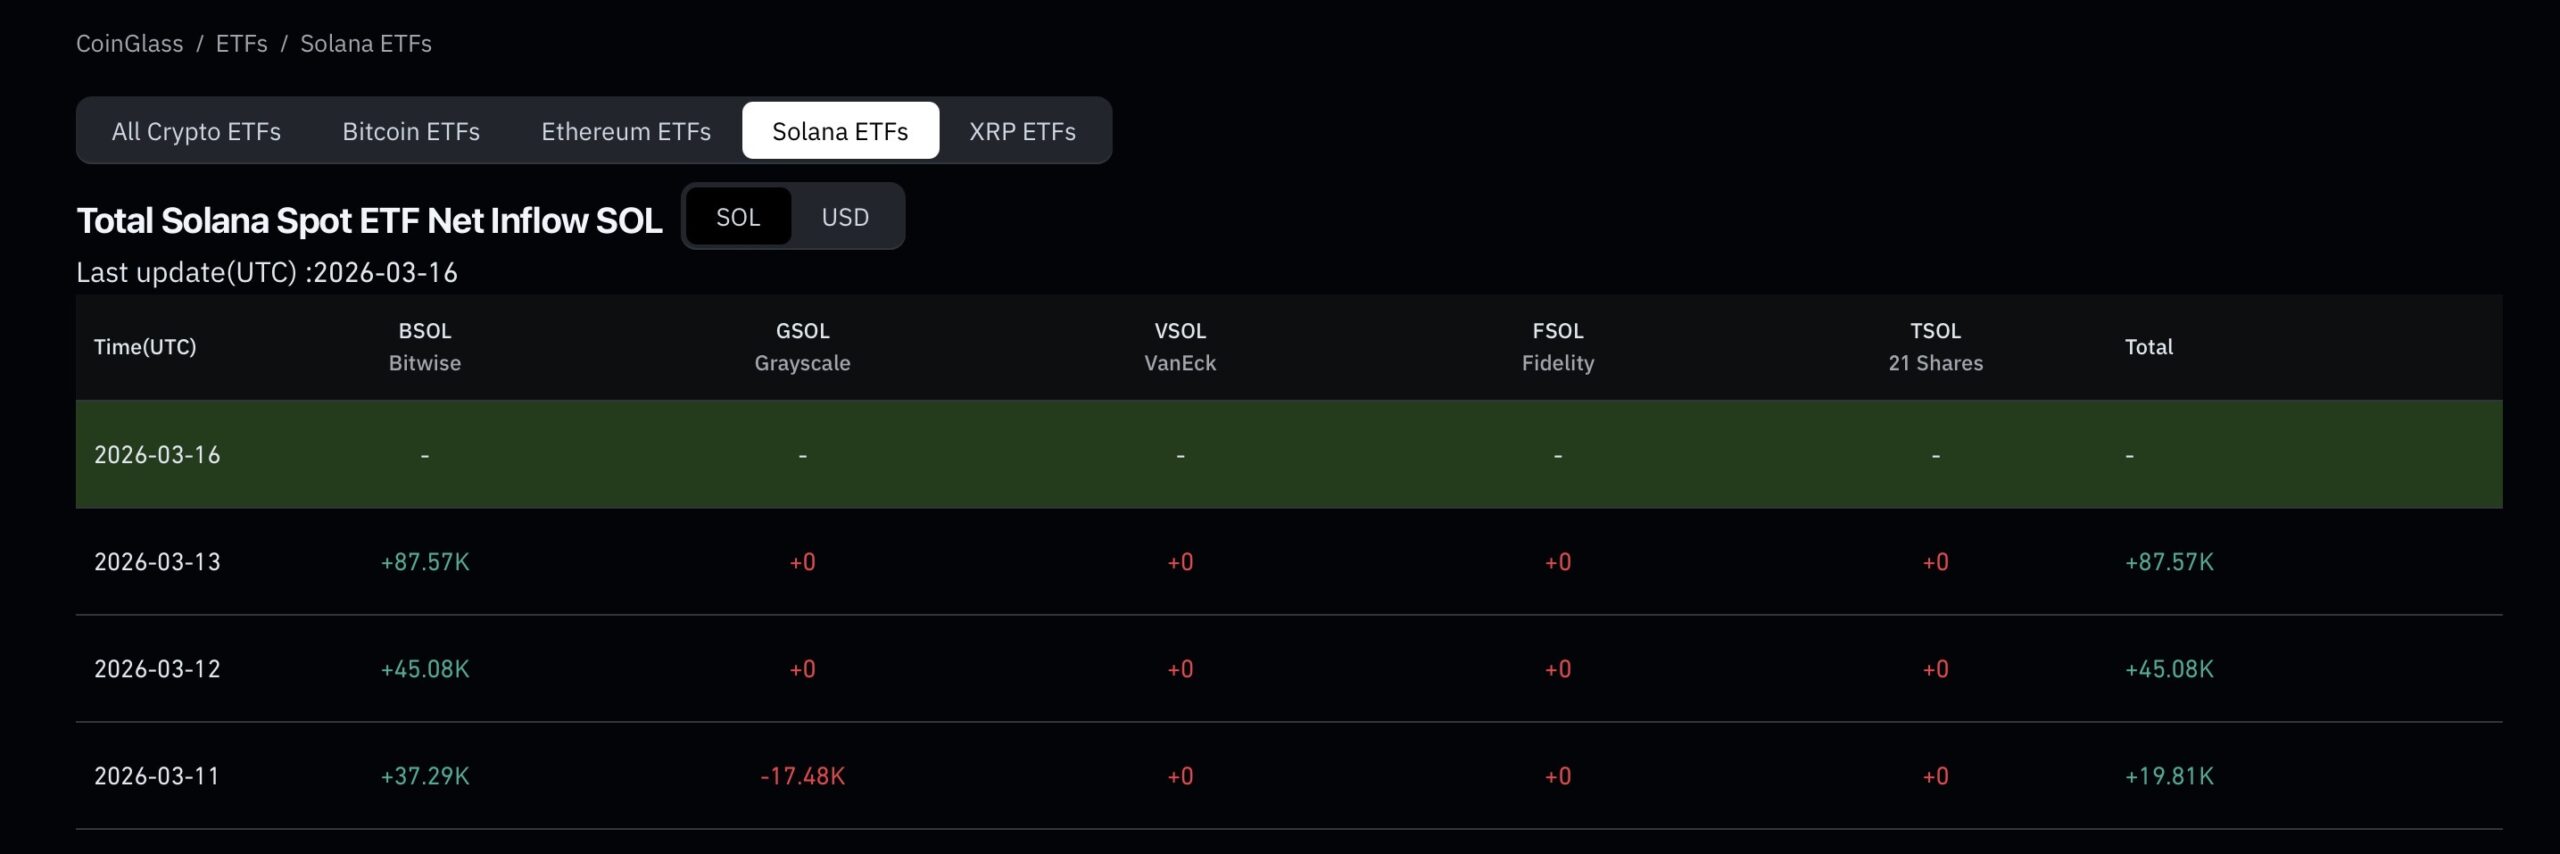
This steady buying pressure suggests that the Solana price surge past $90 was not an accident: it was backed by smart money positioning for a long-term hold. This creates a “soft floor” under the price, making it difficult for bears to push SOL below the mid-$80s without significant volume.
However, there is a glaring contradiction here. With nearly $1 billion in institutional inflows this cycle, Solana should arguably be trading much higher. The fact that price is struggling to reclaim $100 despite this buying pressure implies that someone else is selling into this strength. That “someone” is likely the retail market, which is cooling off rapidly.
DISCOVER: Best Crypto to Buy Now
Solana Price Analysis: The Head-and-Shoulders Boss Fight
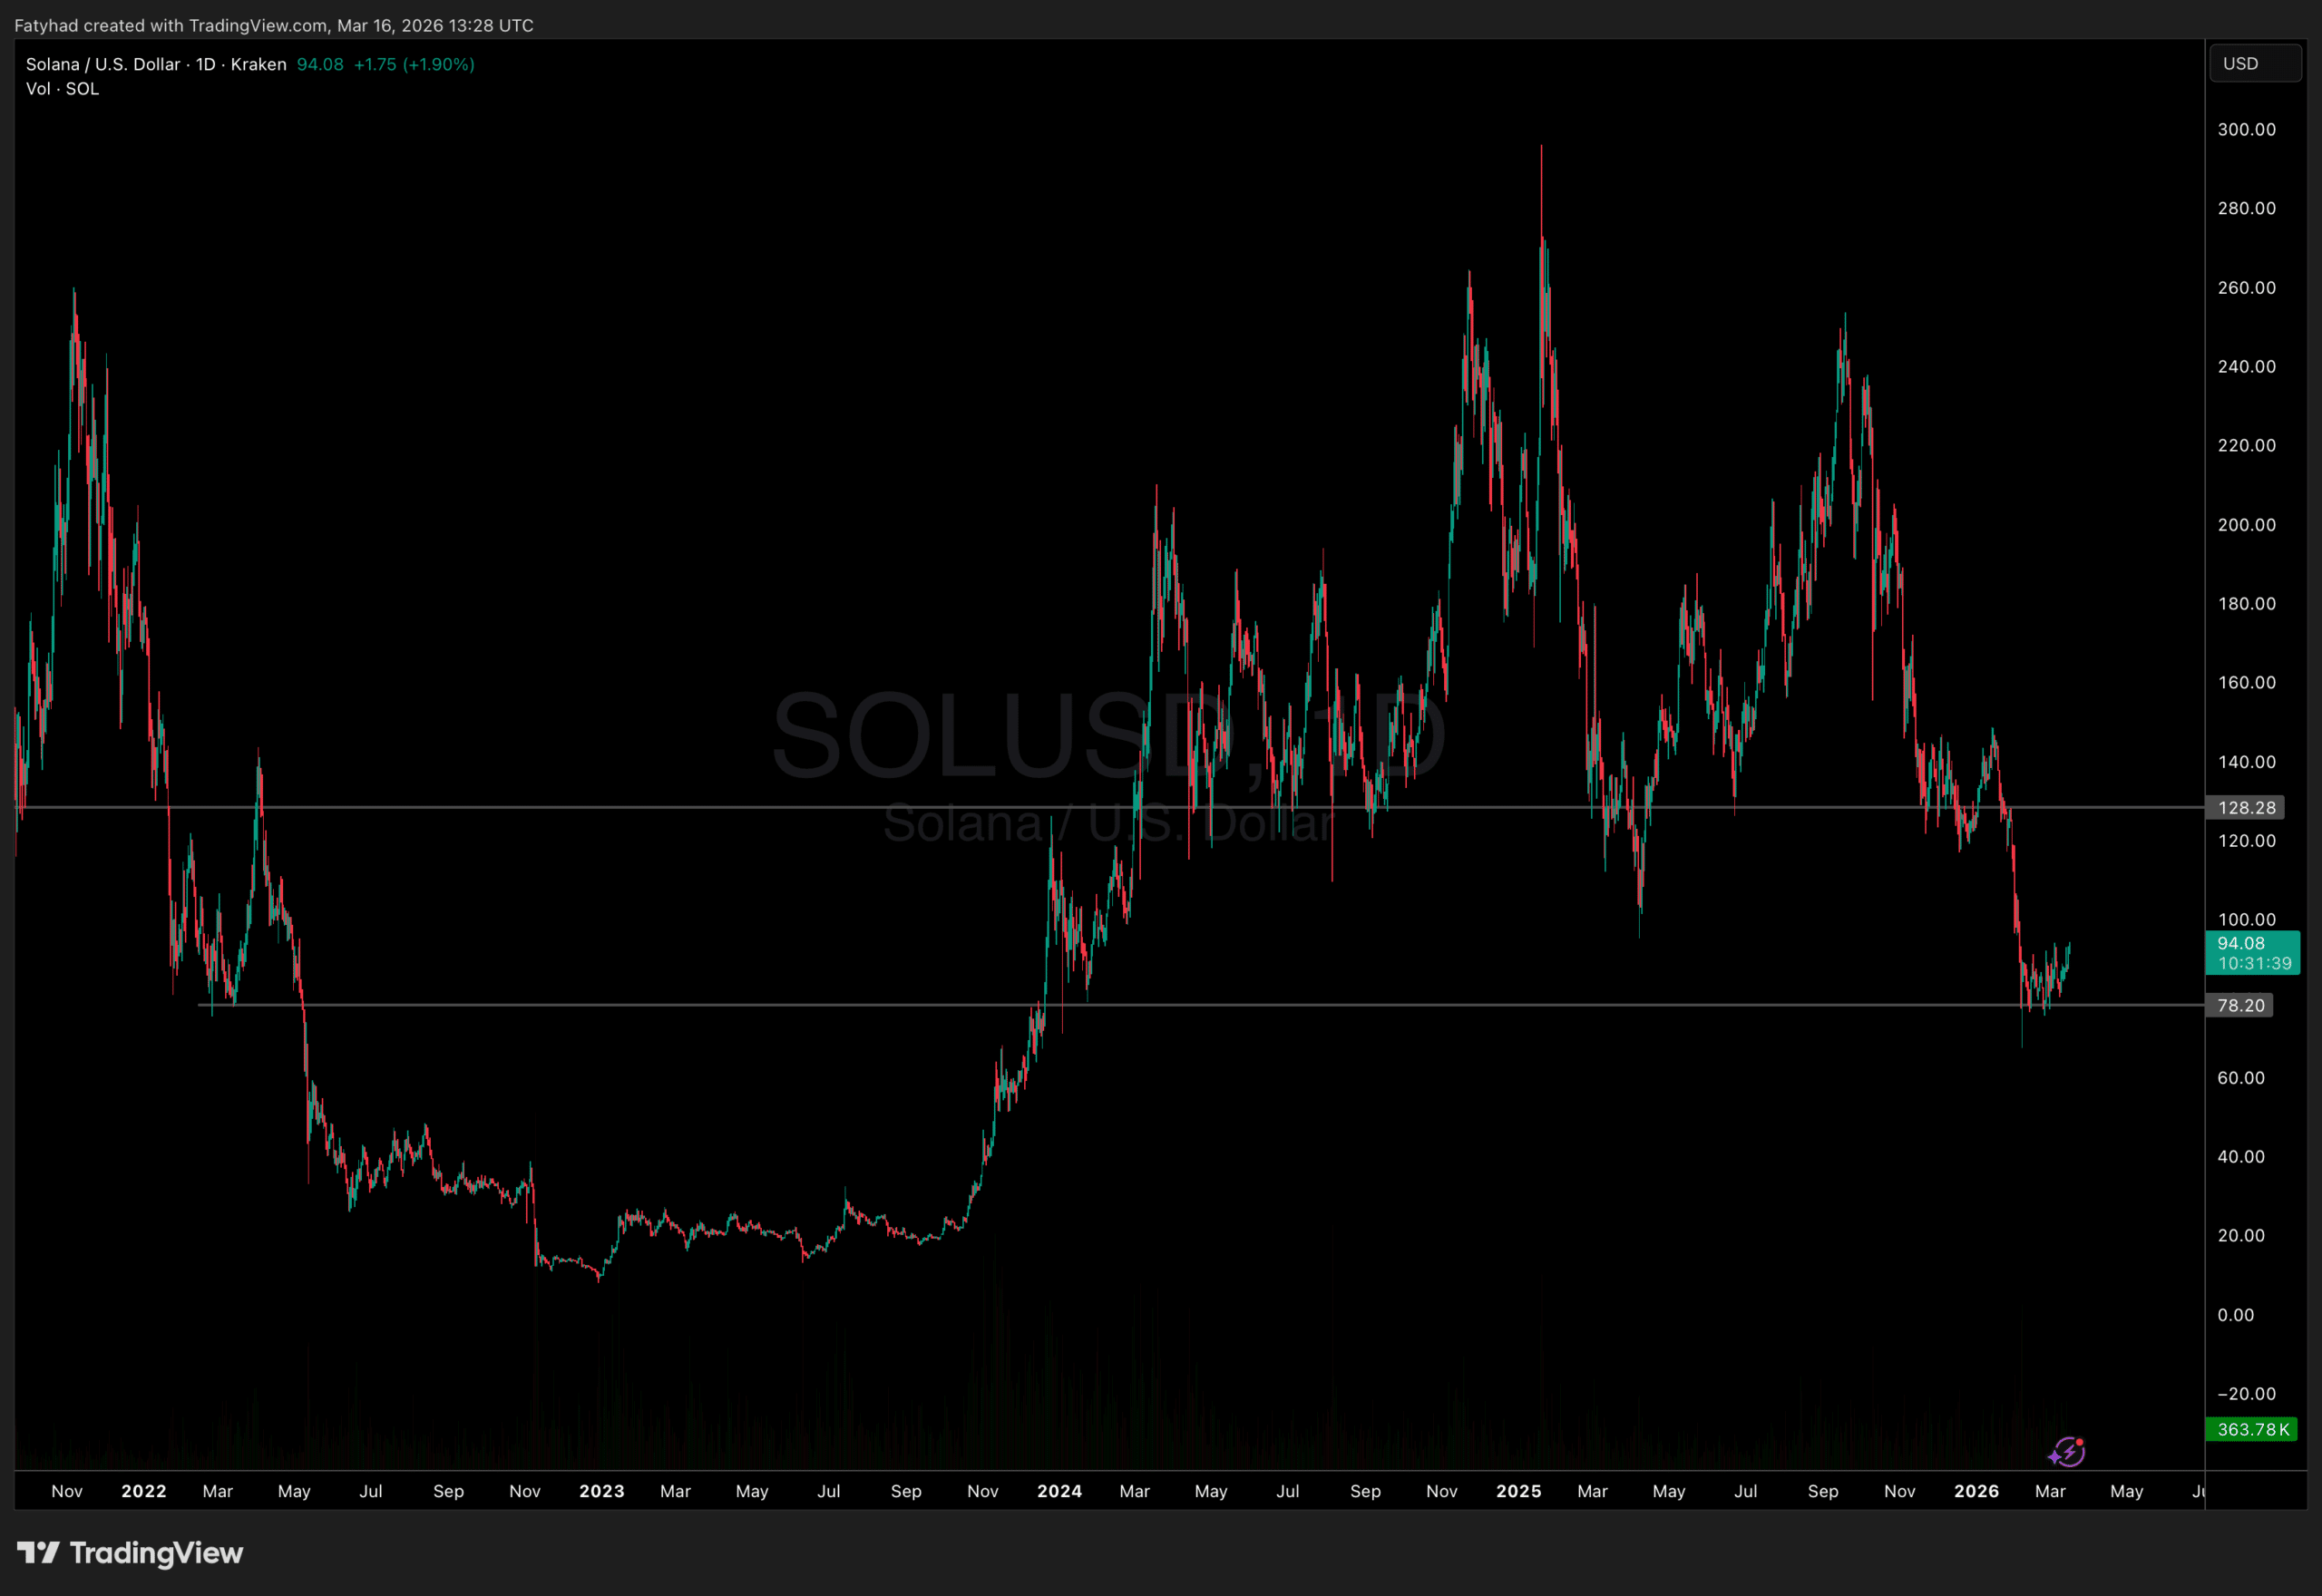
While the fundamental inflow data is bullish, the chart is screaming caution. Solana is currently printing a potential head-and-shoulders pattern, a structure that often marks the end of a bullish trend. Traders are eyeing the “left shoulder” peak at roughly $105 and the “head” at $126. The current price action around $93 is forming the “right shoulder.”
The neckline sits between $80. If SOL fails to break above $100 and instead rolls over to break below $80, the pattern confirms. The theoretical target for such a breakdown is the height of the pattern subtracted from the neckline, which points to a brutal drop toward $60 or even $55.
This pattern is why the $100 level is so important. A decisive daily close above $100 invalidates the right shoulder, destroys the bearish thesis, and likely triggers a short squeeze as bears scramble to cover. Until that happens, the threat of a reversal remains the dominant narrative on the chart.
DISCOVER: Top Crypto Presales to Watch Now
Follow 99Bitcoins on X (Twitter) For the Latest Market Updates and Subscribe on YouTube For Daily Expert Market Analysis.
The post Solana ETF Inflows Grow: Will SOL Finally Break $100? appeared first on 99Bitcoins.


